APIs have become one of the core components of many software systems today. As soon as an API becomes unavailable, some or all parts of dependent software systems become unavailable, so it’s essential for software teams of any size to monitor their running APIs closely and act as soon as the API monitoring tool identifies and reports an abnormality. In our What is API Monitoring article, we went through different kinds of API monitoring; in this article, we will review top 11 API monitoring tools for functional API monitoring and API Availability monitoring.
Testfully
Website: testfully.io | Pricing: Free, Paid plans start from $49 a month
Testfully has focused on API testing and API monitoring. As a result, we offer a great range of features for API health-check monitoring and API functional monitoring, which are available to all users, including users who are on the free plan. Using Testfully, you can define your test cases, add them to collections and run the collection against your desired environment. Testfully alerts you as soon as one of the monitoring tests fails.
Testfully pros for API monitoring
- Testfully offers a free plan
- Unlike other tools, free users can run API monitoring tasks as fast as every minute.
- Unlike Postman, you can define multistep (request chaining) monitoring tests in Testfully
- Testfully offers various filtering options to narrow down test results for monitoring tasks
- Testfully offers a comprehensive test log for any executed test
Testfully cons for API monitoring
- You can only monitor Restful & GraphQL APIs using Testfully. Soap APIs are not currently supported.
How to monitor API using Testfully
Monitoring API using Testfully is a simply 2-step process: Add a test and add a collection. To create your first monitoring task in Testfully, please follow the below steps:
- Log in to your Testfully Dashboard and click on the “Tests” link.
- Click on the “New Test” button
- Add your test case and click on the “Save” button
- Click on the “Collections” link of the navbar
- Click on the “New Collection” button
- Pick a name for your collection, select the test cases you wish to include in your collection, and fill in the monitoring task details
- Click on the “Save” button to add your collection and monitoring task
- Testfully starts running your task on defined intervals.
Postman
Website: postman.com | Price: Free, Paid plans start from $15 (per month, per user)
API monitoring is one of the features that Postman offers, albeit this feature is only available for registered users (including free plan users). Postman API monitoring is in the form of running a Postman collection on the cloud and based on the defined interval. The number of monitoring tasks, how often Postman runs them, and the delivery of alerts depends on your current billing plan.
Postman pros for API monitoring
- You can use your API integration tests for monitoring
- Monitoring is available for users on the free plan
Postman cons for API monitoring
- Postman does not support request chaining (multistep tests), so you are limited to tests with a single step
- Although you have access to past test runs, the log is minimal
- To set validations for tests, you need to know Javascript
How to monitor API using Postman
As we mentioned earlier, you need to sign up for an account to enable the API monitoring feature of Postman. API monitoring in Postman is a 3-step process: Create a collection, add a test to your collection and create a monitoring task. Please follow the below steps to create your API monitoring task in Postman:
- Log in to your account and click on the “Collections” icon on the left bar
- Click on the + icon to add a new collection to your workspace in Postman
- Hover over the collection and click on the little ”…” icon, then click on the Add request link
- Complete the form as you wish; click on the “Send” button to test your test
- Click on the “Monitors” icon on the left menu bar to open the monitoring feature of Postman
- Click on the ”+” icon to add a new monitoring task
- Complete the form and click on Create button
- Click on the “Run” button to run the monitoring task manually
- Postman starts running your API monitoring task in the background
Runscope
Website: runscope.com | Pricing: Free Trial, Plans start from $79 a month.
Using Runscope, you can define functional tests and schedule them to run in the background. However, unlike Postman and Testfully, you cannot group multiple tests under one monitoring task, so each test is scheduled separately, which increases your maintenance overhead.
Runscope pros for API monitoring
- Runscope supports request chaining (multistep tests)
- Details of each executed test is available via a web-based dashboard
Runscope cons for API monitoring
- Runscope does not offer a free plan
- Setting JSON body validation for a request can be time-consuming
- You cannot group multiple tests into one schedule for API monitoring
- Runscope stores the full step (HTTP request/response) details for the last 100 successes and the last 100 failures.
How to monitor API using Runscope
- Log in to your Runscope dashboard and click on “Create Test” and then “New test” button
- Complete the form and click on the “Create Test” button
- Add the requests you wish to include in your tests and click on “Save” after completing the form
- Click on “Run Now” to run your test manually; make sure You get the “Passed” message on left
- Click on the “Schedules” link on the left menu bar to open the schedule UI
- Click on the “Add Schedule” to add a new schedule
- Set values as you wish and then click on the “Save Schedule” button
- Runscope starts running your tests in the background
API Fortress
Website: apifortress.com | Pricing: 30 days trial, Contact API Fortress for pricing
API Fortress is another tool with a focus on API testing & Monitoring. Similar to Testfully and Postman, API Fortress allows you to define integration tests and use them for API monitoring purposes. However, you cannot group multiple tests and schedule them in one go, so you need to schedule your tests one by one. Nevertheless, API Fortress test results are comprehensive and easy to use for debugging purposes.
API Fortress pros for API monitoring
- API Fortress supports Multistep tests (request chaining)
- API Fortress provides multiple filtering options to narrow down test results for monitoring tasks
API Fortress cons for API monitoring
- API Fortress does not offer a free plan
- Your monitoring tasks run as frequently as every 5 minutes.
- You cannot group multiple tests into one monitoring task.
- Monitoring test results do not contain responses to HTTP requests.
How to monitor API using API Fortress
Monitoring an API using API Fortress is a 4-step process: Create a project, add test, publish the test and schedule the monitoring task. To monitor your API using API Fortress, please follow the below steps:
- Log in to your API Fortress dashboard and click on the “Create project” button
- Complete the form and click on the “tick” icon to save the project
- Click on the “Tets” button within your project snippet
- Click on the ”+ New Test” button
- Complete the form and click on the “tick” icon to save the test
- Click on the “Compose” button
- Click on the “Add Request/Assertions” button
- Click one of the HTTP methods to create the HTTP request
- Complete the form and click on the little “tick” button on the right corner of the form
- Click on the “Save” button to save your test
- Click on the “Run” button to try the test; make sure it passes
- Click on the “Tests” button and then click on the test you just added
- Click on the “Publish” button to publish your test
- Click on the “Schedule” button to schedule your test for monitoring
- Click on the “Create new run” button
- Complete the form as you desire and click on the Save Run button
- API Fortress will start running your test in the background for you
Assertible
Website: assertible.com | Pricing: Free, Paid plans start from $25 a month
Assertible’s focus is on API testing and Monitoring, similar to Testfully and API Fortress, so that you can use your API integration tests for Monitoring purposes as well. Assertible allows you to group multiple tests and run them as a monitoring task. Depending on your plan, you get different frequency options. Assertible can run monitoring tasks every minute.
Assertible pros for API monitoring
- A very easy to use dashboard
- Offers a free plan with monitoring capabilities included
Assertible cons for API monitoring
- Assertible does not support request chaining
How to monitor API using Assertible
Creating a monitoring task in Assertible is a 3-step process: Create a service, add a test, and add a monitoring task. To create your first API Monitoring task in Assertible, please follow the below steps to add your monitoring task to your Assertible task:
- Log in to your Assertible dashboard and click on the “Services” button and then the “New Web service” button (skip if you have already added service to your account)
- Provide the URL of your API in the “Enter a URL” section and click on the “Import URL” button
- Click on “Create service and tests” to create your new service
- Assertible creates a new service for you alongside an environment called “Production” and a test called “200 OK”
- Click on the ”+” button and then click on the “Create basic test” to create a new test
- Complete the form as you desire and then click on the “Save” button
- Click on the “Run test” button to run your test
- Click on the “Monitoring” tab to open the API monitoring feature of Assertible
- Click on “Add another schedule” to create a new monitoring task
- Complete the form as you wish and then click on the “Create schedule”
- Select the test cases you wish to run as part of this monitoring task
- Click on “Done” to create the task
- Assertible starts running your monitoring task based on the defined frequency of execution
- Check the “Results” tab for test results
Data Dog Synthetics
Website: datadoghq.com | Pricing: Free Trial, Paid plans start from $5 a month
DataDog offers a range of products in the monitoring and security space, and synthetic monitoring is one of them, allowing you to monitor your websites, web applications, and APIs. It tracks web pages and APIs at any network level in a controlled and stable way using API Tests, Multistep API Tests, Browser Tests.
Data Dog Pros for API monitoring
- DataDog synthetic monitoring offers multistep tests (Chained requests). For example, you can use the multistep test to authenticate first and use the token to send the main request to your API.
- You can use globals to reuse values in multiple tests
- You can run monitoring tests every 30 seconds
Data Dog Cons for API monitoring
- DataDog synthetic monitoring doesn’t offer a free plan.
- You cannot group multiple tests into one monitoring task, so if you want to run multiple tests simultaneously, you need to create multiple monitors.
- The response headers and body of the request become available when a test fails, so there is no way to see the response when the test passes.
How to monitor API using DataDog synthetics API monitoring
- Log in to your DataDog account; on the welcome page, from the vertical bar located on the left, click on the sun-shaped sign. On that menu, select the Synthetic Tests
- From the three test options, choose a new Test API.
- Define your request by selecting the HTTP request Methods on the dropdown menu, then write a valid desired URL.
- Click on the advanced option if you want to add some more to the request. For example, to give a request body, select the body type, then fill in the request body.
- You can always Test the given Url by clicking on the Test Url.
- Fill out the name box.
- Define assertions, click on the new assertion, define the assertion type; for example, choose “status code,” then complete the assertion by filling in the blanks.
- Select Locations
- Specify Test frequency. You can decide how API repeats a test in chosen intervals.
- Define the Alert conditions. It defines on what state the test returns the “Alert” status code.
- At last, you can select to notify the team by sending a message to their email addresses if the test status is Alert.
- Click on the Create Test button.
- The DataDog API will run your test in the given interval.
SemaText Synthetics
Website: sematext.com | Pricing: Free Trial, Paid plans start from $5 a month
Sematext Synthetics is Another API monitoring tool. It can monitor APIs and Web URLs, websites, and user experiences from many different locations worldwide. It helps you to detect the performance and downtime of your APIs. For example, we can simulate the hectic workloads on our API and see how it works. You can monitor your local API by installing the Sematext agent as well.
SemaText Pros for API monitoring
- Very simple UI.
- We can set Private Locations.
- We can configure the Alerts and their intervals in case of failure.
- SemaText has many integrations for alerting, including Slack, Telegram, and Microsoft Teams. You can also receive alerts via email.
- Sematext offers Status Page for each monitoring. It’s publicly available, and you can share it with your customers or include it on your website.
SemaText Cons for API monitoring
- SemaText synthetic monitoring doesn’t offer a free plan.
- You cannot define multistep tests. For example, you cannot use one endpoint to get a token and use the token in the next step.
- We can’t config a global variable to reuse it on the tests.
- We cannot group multiple tests into one monitoring task.
- Sematext shows the response headers and body only when the monitoring fails.
How to monitor API using SemaText synthetics API monitoring
- Log in to your SemaText account
- From the vertical bar on the left, choose the Synthetics with a happy face sign. On that menu, we can see the All Monitors and All Apps menus.
- Select the All Apps menu, create a new Synthetic App
- Fill in the name of the App, then click create.
- Now, we are In the created App; select Monitors, and create a new Monitor.
- On the pop-up window, select HTTP Monitor.
- Fill in the name, HTTP method, URLs, interval, and tick locations; it can be more than one location.
- Click “Continue”
- Configure Request menu allows you to configure the request headers, body, query params, and cookies.
- Click Continue when you’re done
- In this section, we can configure Alerts. When a condition fails, we will be alerted.
- Use the Conditions section to configure asserions for your test.
- Click on Create button to create a monitor
Checkly
Website: checklyhq.com | Pricing: Free (For Developers), Paid plans start from $ 1.20 per 10k API check runs.
If you’re looking for a powerful monitoring tool, we suggest trying Checkly. It offers many features to monitor your APIs, such as creating requests, assertions, scripting, setting global environments, scheduling alerts, running a group of checks simultaneously, maintenance window, status page, variables and the check defaults. Please continue reading as we review the mentioned features and the pros and cons of the checkly as an API monitoring tool.
Checkly pros for API monitoring
- Checkly offers a free plan for developers.
- You can define the global variables and use them in API monitoring checks. In addition, you can lock them to limit who can access them.
- You can set up alerts for API checks.
- Checkly integrates with many services like Slack, Webhook, Discord, PagerDuty, Email, SMS and more for better and more flexible alerting.
- The maintenance window lets you disable your checks when you have planned downtime for release or maintenance purposes.
- Checkly offers status pages, public pages you can share with your customers and reflect the availability of your web services.
- Checkly can run your checks every 10 seconds!
- Complete request & response information of each check is available via dashboard.
Checkly cons for API monitoring
- Checkly offers groups to run a group of checks on one run and has sharing alerts, assertions for checks on the same group. Still, it doesn’t support scheduling for a group, and you need to set schedules for every check individually.
- Checkly doesn’t support multi-steps (chained) requests. Still, since it supports scripting (writing javaScript code), we can use them for this purpose.
How to monitor API using Checkly API monitoring
- Check is Checkly’s core concept. A check consists of many elements such as making a request, running the setup/teardown scripts, adding assertions, etc. so, Let’s create a check from scratch.
- Sign up (or log in, if you have an account) and click on the “Create New” button and select the “API check” option.
- Pick a name for your check; you can also dedicate a tag to it.
- Select the desired HTTP method and fill in the API endpoint URL.
- If you need to add more information to your request, you can use one of the Body, Headers, Query Params or Authentication tabs.
- You can add setup and team down scripts to the check as well. The setup script runs before your HTTP request, and the teardown script runs after your HTTP request and has access to the response data. In addition, you can add a code snippet from the code snippet collection that you wrote before (you can find it on the menu bar, with the (<>) sign, or add inline codes while creating. Checkly supports Javascript as the programming language for setup and the teardown scripts.
- You can set response time limits. There are two thresholds for the response: degraded (default response time is 5 sec) and failed (default response time is 20 sec).
- Next, you can add assertions to your request without typing any codes and just by selecting an element of your request in the dropdown, such as status code, body, headers, etc., and setting the expected value for them. Finally, Checkly alerts you if one or more of your assertions fail.
- Using the Data Centre Locations, you can choose the data centre locations Checkly should use for sending the requests. Checkly recommends choosing at least two data centres so you can monitor your API latency and availability with more than one geographic location.
- You can set the interval Checkly should run your check using the slider.
- Using the alerts section, you can set where you should receive alerts.
API Science
Website: apiscience.com | Price: Free Trial (30 days), Paid plans start from $29 per month
API Science is yet another API monitoring tool in the market. If you want to ensure that your API performance is consistently high, you can count on its help. API science offers you monitors to make requests, add validations, make multi-step requests, set alarms and more. Also, you can get pretty decent reports of your API.
API Science pros for API monitoring
- API Science supports multi-step requests.
- You can add various alert rules for your requests and select when and where to receive the alerts.
- API Science can Integrate with other applications such as PagerDuty, Email, etc.
- API Science has a powerful report system. You can get specific report histories for your selected monitor, based on the report type ( performance or alert, uptime, and check history ), a “Quick-Select” option ( last 24 hours, last seven days, etc. ), and the dates ( from-to ). Moreover, you can choose to see only errors.
- You can access complete request & response information via the dashboard.
API Science cons for API monitoring
- API Science doesn’t offer a free plan.
- You can’t set global environment variables and reuse them again.
- API Science doesn’t support a group of requests to fire them in one run.
- There is no status page as a public page to show your customers regarding the availability of your website.
How to monitor API using API Science
- First, sign up or log in to your account. After that, the website redirects you to your dashboard. It contains previously created monitors as samples.
- At the right side of the dashboard page, click on the “Add Monitor” button.
- You can add the desired API endpoint URL in the textbox.
- Select an HTTP method from the dropdown.
- If you want to add some more to your request, click on the “Show setting” below the URL textbox,
- You can add a query parameter by filling in the “Key” and the “value” fields; if you need to add some more parameters, just click the “+” sign on the right.
- You can add a header to your request by filling in the “Header” and the “value”. So, of course, you can always use the “+” button to add more header fields.
- A validation in API science is the assertion you can make to test your request. There are five kinds of validations. Response Code, Regex, Validate JSON, JavaScript, Max Response time(ms). To add more than one validation, click on +.
- API Science allows you to embed standard JavaScript using a “Pre-Process script” that runs before any requests. You can use this as a setup in your request or between the steps of a multi-step request.
- Add a name for your monitor.
- Define your request’s execution frequency. The default is 30 minutes.
- You can choose a location where your request runs from there.
- You can pick a tag for your request as well.
- In the end, either you can test your monitor or save it.
Dynatrace Synthetics
Website: dynatrace.com | Pricing: Free Trial ( 15 days ), Paid plans start from $ 11 per month for 10k, Digital Experience Monitoring
The Dynatrace monitoring tool is an enterprise-grade technology that can provide real-time insights into the performance and health of your application. It also comes with a wide range of pre-built dashboards that you can configure based on the organisation’s requirements. Here, we aim to review the Dynatrace Synthetics HTTP monitoring tool. You can check your API by sending HTTP requests to the desired endpoints, setting intervals, executing them against various environments, specifying validations of three types (response status code, text or a regular expression and SSL certificate expiry), and many more.
Dynatrace Synthetics Pros for API monitoring
- It supports Integration with many applications such as Email, PagerDuty, Slack, etc.
- The maintenance window allows you to suspend any problem detection during maintenance, so no notifications are sent to the dashboard or your third-party apps.
- It supports grouping requests and triggers them in one run.
- It runs tests from powerful cloud-based data centres such as AWS, Google, Azure.
Dynatrace Synthetics Cons for API monitoring
- You cannot run tests on demand.
- It doesn’t offer a free plan.
- The alarm system can be challenging to understand and use at times.
- It doesn’t support multi-step (chained) requests.
- It only supports a limited set of assertions.
- We couldn’t find anything related to global variables in the Dynatrace dashboard.
- The documentation is outdated
How to monitor API using Dynatrace Synthetics
- On the Dynatrace website, choose the SaaS login menu to sign in or use the free trial link to sign up.
- Find “Application & Microservices” from the left menu bar, then click on the “Synthetics” sub-menu.
- Click on the “Create a synthetic monitor” on the right, top of the page.
- Click on the “Create HTTP monitor” as your monitor type is HTTP.
- On the configuration page, pick a name for this HTTP monitor.
- You can add the tags to it.
- You can create an HTTP request through “Visual mode” (default), which is UI (user interface), Also through “Script mode” by writing JSON script. We use visual mode in this article.
- Click on “Add HTTP request”.
- Choose the request type “HTTP request” from the dropdown.
- You can add the API endpoint URL.
- Choose a name for your request.
- Choose the desired HTTP method from the dropdown.
- Click on the “Add HTTP request” button.
- In the expanded request details, you can add a user agent (optional).
- On the “Response status code verification” part, you can add assertions based on returned HTTP status codes, select “Fail if” or “Pass if” from the dropdown. Then specify an exact status code, inequality symbols (<, <=, >, >=, !=), range (using minus sign with no space) or status class mask (xx only) of desired response HTTP codes.
- In the “Additional options” section, you can enable the pre-execution script and add JavaScript codes to run before your request.
- Also, you can enable a post-execution script and add some JavaScript codes to run after your request.
- Next, you can set authentication and authorisation.
- Also, you can add a client certificate.
- Setting additional HTTP headers, you can add many headers by clicking on the “Add header” button and filling in the header name and the header value.
- On the “Set rules for response validation” part, you can add another validation to your request by selecting “Pass if” or “Fail if” from the dropdown and fill in the textbox. Here, Dynatrace Synthetics checks the first 50 KB of the response body, finding a specified text string or a regular expression (if you check the “Interpret content to match as the regular expression” checkbox) that you’ve entered.
- Click on the “Next” button to continue; you can always go back to the previous pages by clicking the “Back” button.
- In the “Frequency and Locations” section, you can set the interval of your monitor to run every specified minute by selecting it from the dropdown. The default interval is one minute.
- Next, you can select the Dynatrace global synthetic public locations among the given list or use your private locations. Bear in mind, at least one is mandatory. Click “Next” to continue.
- The summary page shows brief information about your requests and the monitor.
- Click on the “Create HTTP monitor” button.
- You can see all the created HTTP monitors on the Synthetic page. Select one of them and click on “Edit”.
- In the “Monitor Setup” menu, you can set cookies on the “Monitor Settings” page; in “HTTP Requests”, you can see requests in this monitor and edit them.
- In the “Outage handling” menu, you can tell Dynatrace when generating a problem and alert it to you.
- In the “Performance threshold” menu, you can add a threshold by defining it for every monitor’s request and telling Dynatrace to generate a problem when performance is not as you expected.
- These mentioned menus from “Monitor Settings” are only available on the Edit mode.
UptimeRobot
Website: uptimerobot.com | Price: Free, Paid plans start from $7 per month
With UptimeRobot, you can monitor the uptime and availability of your website thoroughly and use some of its features for API monitoring as well. UptimeRobot offers a free plan with 50 monitors every 5 minutes, and you can purchase a monthly subscription.
UptimeRobot pros for API monitoring
- It offers a free plan.
- It supports alerting; you can define who gets notified.
- UptimeRobot supports status pages; you can publically share them with your customers, partners, or colleagues to get informed about the current state of your API.
- It offers a decent reporting feature; it comes with the latest events for all monitors, like monitor’s status (up, down, pause); by clicking on a monitor, you can get more information about the request’s uptime, response time, and many more.
- It supports integration with Slack, Pagerduty, Email, Telegram, and other tools and services.
UptimeRobot cons for API monitoring
- It doesn’t support multi-step (chained) requests.
- It doesn’t support global variables.
- You can’t see the request and response anywhere.
- It doesn’t offer run-on-demand.
- It offers a limited set of validations (status codes and keyword searching)
- It doesn’t support a group of requests to run under one hood.
- You can’t run your requests from your private locations.
- It doesn’t allow you to choose between public locations for your requests.
- It doesn’t support team collaboration.
- Custom headers and HTTP status checks are available on paid plans only.
How to monitor API using UptimeRobot
UptimeRobot monitor offers various monitor types; we only discuss the HTTP(S), keyword, and ping here.
HTTP(S)
- First of all, register for the UptimeRobot service, or log in to your account.
- Click on the “Monitor” button on the top left of the page.
- Choose the HTTP(s) from the Monitor Type dropdown list.
- Pick a name for your monitor.
- Add the API endpoint you want to monitor
- Adjust the monitoring interval; the default is 5 minutes.
- You can set your monitoring request timeout from one second to one minute; the default is 30 seconds.
- You can add more optional parts to your requests, such as authentication settings. You can find them in the advance setting section.
- Next, define who gets the notifications when something goes wrong; you can select the contacts between the list you’ve already created. You can find the list of contacts in my setting menu on the top of the main page.
- In the end, click on the create monitor button.
Keyword
- Click on the “Monitor” button on the top left of the page.
- Choose “Keyword” from the Monitor Type dropdown list.
- Pick a name for your monitor.
- Add the API endpoint you want to monitor
- You can enter a keyword in the textbox.
- Select one of the “Keyword Exists” and “Not Exists” options; you set what conditions UPtimeRobot alerts you.
- Adjust your monitoring interval; the default is 5 minutes.
- You can set your monitoring request timeout from one second to one minute; the default is 30 seconds.
- You can add authentication settings and custom headers (pro) optionally.
- Next, you can select the contacts from the list.
- Then, click on the create monitor button.
Ping
- Create a monitor.
- Choose “Ping” from the dropdown list.
- Pick a name for your monitor.
- Add your desired IP address or host.
- Set your monitoring interval; the default is 5 minutes.
- Select recipients to get notified.
- Finally, you can click on the create monitor button.
Pingdom Synthetics
Website: pingdom.com | Price: Free Trial (30 days), Paid plans start from $15 per month
Pingdom is another monitoring tool for web applications and websites. However, you can use it for some basic API monitoring purposes, but it doesn’t offer you a fully-fledged API monitoring tool. Here, we aim to discuss two of Pingdom synthetic’s features to monitor your APIs; these features are uptime and speed (page speed). Uptime helps you check the API’s availability, while page speed checks its performance.
Pingdom Synthetics Pros for API monitoring
- It supports integration with third-party apps such as Slack, Email, etc.
- It supports alerting. You can define who gets notified.
- It offers an efficient report area. So you can see your request information there, such as uptime changes, test result log, etc.
- You can choose between multiple public locations (data centres) to call your API through them.
- It offers a status page that you can share publically to share the availability and speed of your API with your customers and partners.
- It offers the Maintenance feature, setting downtime and duration to disable the checks during maintenance.
Pingdom Synthetics Cons for API monitoring
- It doesn’t support multi-step (chained) requests.
- It doesn’t support any global variables.
- You can only send GET and POST requests.
- Pingdom doesn’t support assertions. However, it can check for the specific string you defined anywhere in your HTML. Also, it can check a script that is in a specific URL with a Pingdom format (XML).
- You can’t define any private location using Pingdom.
- You can’t run a group of requests simultaneously.
- Pingdom doesn’t support team collaboration.
How to monitor API using Pingdom Synthetics
Uptime
- Start a free trial or Login to the Pingdom website.
- After you log in, select the Uptime feature in your dashboard and click on the Get started button or, choose the Synthetic sign below the home sign from the menu bar on the left of the page. Then choose the Uptime feature.
- Click on the Add new button at the top right of the page to add an uptime check.
- Pick a name for your check.
- Select the check’s interval (the default, 1 minute).
- Choose the Web tab.
- Select the HTTP(s) check type.
- Fill in the desired endpoint URL in the required tab.
- Select a location from the list (the default, North America and Europe).
- You can add a tag to your request.
- Select the check importance in high or low from the dropdown in the alert settings section.
- Choose to whom you want Pingdom to alert.
- Select after how many minutes consider the check down.
- Choose how much time after the check’s down alerting you.
- Resend alert every desired chosen minute.
- Write the customised message you want to send.
- Here, you can integrate a third-party application to send messages.
- You can add to your request some more on the optional tab, such as port, user name, password.
- Next, you can tell Pingdom to search for the specific string anywhere in your request by selecting one of the items in the dropdown, whether it’s the “should contain” or the ” shouldn’t contain” option, and entering the desired string into the textbox.
- To send a POST request, you can fill in the POST data edit box.
- To add a custom header for your request, fill in the request headers textboxes (header name and value).
- In the end, you can click on the test check or the create check button.
Page speed
- Choose the Page Speed feature from the synthetics menu.
- Click on the add check button on the top-right of the page.
- Fill in the desired API endpoint in the URL part.
- Pick a suitable name for your check.
- Next, select a location for your test from the dropdown.
- The check interval is 30 minutes by default.
- Finally, push the save button.
APIToolkit
Website: apitoolkit.io | Price: Free for 20k Requests and 1 team member max, Paid plans start from $20 per month
APIToolkit is a platform offering a suite of API (Application Programming Interface) development, observability, and management tools. APIToolkit has an intuitive interface and simple installation procedures. It’s compatible with multiple programming languages and tech stacks, making it easy to incorporate into diverse development environments. The platform’s interface simplifies API monitoring and management. On the dashboard, you can see pretty lovely charts that help you see the statistics of Requests by Status Code, Latency Percentiles, Errors, Requests by Endpoint and Request Latency Distribution about your API. However, you might face some minor bugs in the UI/UX; they work fine and are easy to use.
Features and Functionality
The ability to support various programming languages like Golang, PHP, Python, .Net and JavaScript makes APIToolkit versatile and accessible to many development teams. This feature ensures that the toolkit can be integrated into diverse tech stacks, making it a valuable asset for many organizations.
The platform allows users to inspect real-time API logs, acknowledge changes and errors for each endpoint in your API and even send you a notification with an email or in Slack when they detect a new endpoint.
It will also automatically generate a Swagger schema for your API. Although it may not be accurate for the request and response properties, it covers the endpoints.
Pricing
The pricing plans offered by the company are as follows:
- The “Free” plan includes 20,000 monthly requests and allows only one team member. It is entirely free of charge.
- The “Hobby” plan includes 250,000 monthly requests and allows up to three team members. It costs $20 per month.
- The “Startup” plan includes 1 million monthly requests and allows up to five team members. It costs $50 per month.
- The “Growth” plan includes 10 million monthly requests and allows up to 10 team members. It costs $250 per month.
Pros and Cons
Pros
- Real-Time Monitoring and Observability: APIToolkit offers robust monitoring capabilities, allowing users to track API performance and errors in real-time, which is crucial for maintaining the health and efficiency of APIs.
- User-Friendly Interface: The dashboard is user-friendly, catering to varying levels of technical expertise.
- Flexible Pricing Options: With various pricing plans, including a free start option, the platform is accessible to businesses of different sizes.
Cons:
- Cost for Advanced Features: While a free option exists, a larger-scale usage could become costly, which might be a consideration for smaller businesses or startups.
- Integration Compatibility: While APIToolkit is designed to be integrated with various technologies, there might be specific use cases or systems where integration could be more complex and fully supported.
Comparison Table
So far, we went through the top 13 best API monitoring tools and reviewed each of them. The table below lists some of the most common features of an API monitoring tool and compares their availability.
| Feature | Testfully | Postman | Runscope | API Fortress | Assertible | DataDog | SemaText | Checkly | API Science | Dynatrace | UptimeRobot | Pingdom | API Toolkit |
|---|---|---|---|---|---|---|---|---|---|---|---|---|---|
| Free plan | Yes | Yes | No | No | Yes | No | No | Yes | No | No | Yes | No | Yes |
| Request Chaining (Multistep test) | Yes | No | Yes | Yes | No | Yes | No | No | Yes | No | No | No | No |
| Group tests for monitoring | Yes | Yes | No | No | Yes | No | No | Yes | No | Yes | No | No | No |
| Execution frequency | 1 minute | 1 minute | 1 minutes | 5 minutes | 1 minute | 30 seconds | 1 minute | 10 seconds | 1 minute | 1 minute | 1 minute | 1 minute | - |
| Execution frequency (Free plan) | 1 minute | 1 hour | - | - | 30 minutes | - | - | 10 seconds | - | - | 5 minutes | - | - |
| No Coding Required | Yes | No | Yes | Yes | Yes | Yes | Yes | Yes | Yes | Yes | Yes | Yes | No |
| Alerts | Yes | Yes | Yes | Yes | Yes | Yes | Yes | Yes | Yes | Yes | Yes | Yes | Yes |
| Status Page | No | No | No | No | No | No | Yes | Yes | No | Yes | No | No |
API Availability Monitoring
API availability monitoring, sometimes called Availability check, API health check, API ping or API status check, is the process of pinging a running API by sending simple requests to the status or health endpoint in intervals. Should your API become unreachable, the API availability check fails, and you will receive a notification. The below diagram describes how API availability monitoring works.

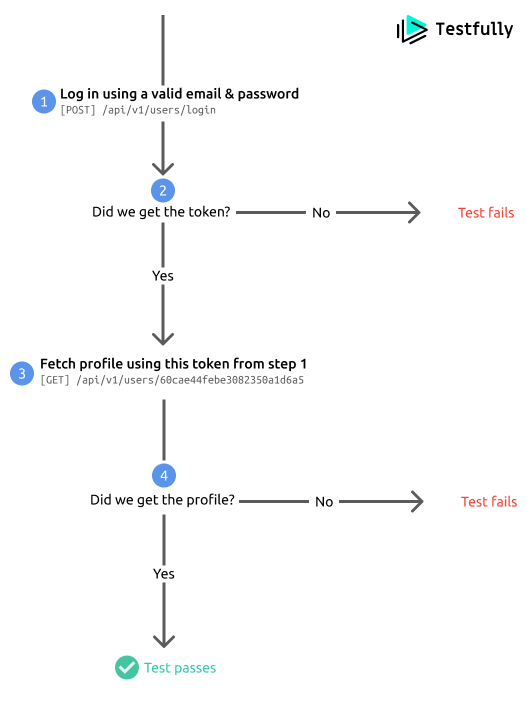
Functional API monitoring
Functional API monitoring is the practice of sending requests to one or multiple endpoints to replicate an end-user scenario in intervals. Functional API monitoring allows teams to monitor critical end-user scenarios closely. For example, the below diagram describes a functional API Monitoring task to monitor the correctness of the “Login & Fetch Profile” scenario. A scenario in which a valid user logs in and tries to fetch their profile.
With a clear understanding of API availability monitoring and functional API monitoring, let’s go ahead and review top 10 API monitoring solutions.
Free APIs for API monitoring
If you’re evaluating different tools for your API monitoring needs, you may not feel comfortable trying out tools using your API. If that’s the case, we have put together a set of Open APIs you can use to evaluate the below API monitoring tools. Although the APIs in this section are free to use, they may impose rate limits, so please keep that in mind when setting your API monitoring tasks. In addition, we highly recommend deleting the tasks once you have finished your evaluation.
- The Rick and Morty API is available in REST and GraphQL. Please check the docs section for more information about how to use their API.
- HTTP Bin is a good API to use for testing API monitoring capabilities. It offers various endpoints to cover different needs.